Data engineering, analytics and modeling
HenriqueMantovani
I’m a production engineer (PUC-SP) with a postgraduate degree in data science and AI (PUC-RS). I build ETL pipelines, data models and predictive analyses, and I’ve done it at IBM, Keyence and Thermo Fisher Scientific.
Most of my projects start with a manual process: reports exported by hand, spreadsheets that freeze, numbers nobody can trace. They end with something automated and auditable that people stop worrying about.
My World Cup 2026 model, re-run after every stage. Spain started second favourite and won the Final. Read the forecast →
Previously atIBMKeyenceThermo Fisher Scientific
Open to full-time, freelance and remote work
Selected work
Built for real operations
Two systems running in production. Company details are kept private.
- 01Data Engineering & Automation
Data platform for a São Paulo distributor, built on Omie ERP
A full internal data platform on top of Omie ERP — scheduled multi-entity extraction into a Parquet warehouse, and Streamlit apps for pipeline management and self-service reporting, including automated overdue-invoice processing.
Python · Omie API · Parquet · Streamlit · Background Jobs
View project - 02Data Engineering & BI
SAP BusinessObjects extraction pipeline automation
A Python-based framework that automated 40 SAP BusinessObjects report extraction workflows without API dependency, consolidating the outputs into a centralized and auditable data warehouse.
Python · Selenium · PyAutoGUI · ETL · SAP
View project
Projects
Independent projects
Varied applications across multiple technologies and use cases, from forecasting to reporting and automation. Each one tackles a problem that also shows up in real business operations.
Featured — Data Science & Sports Modeling
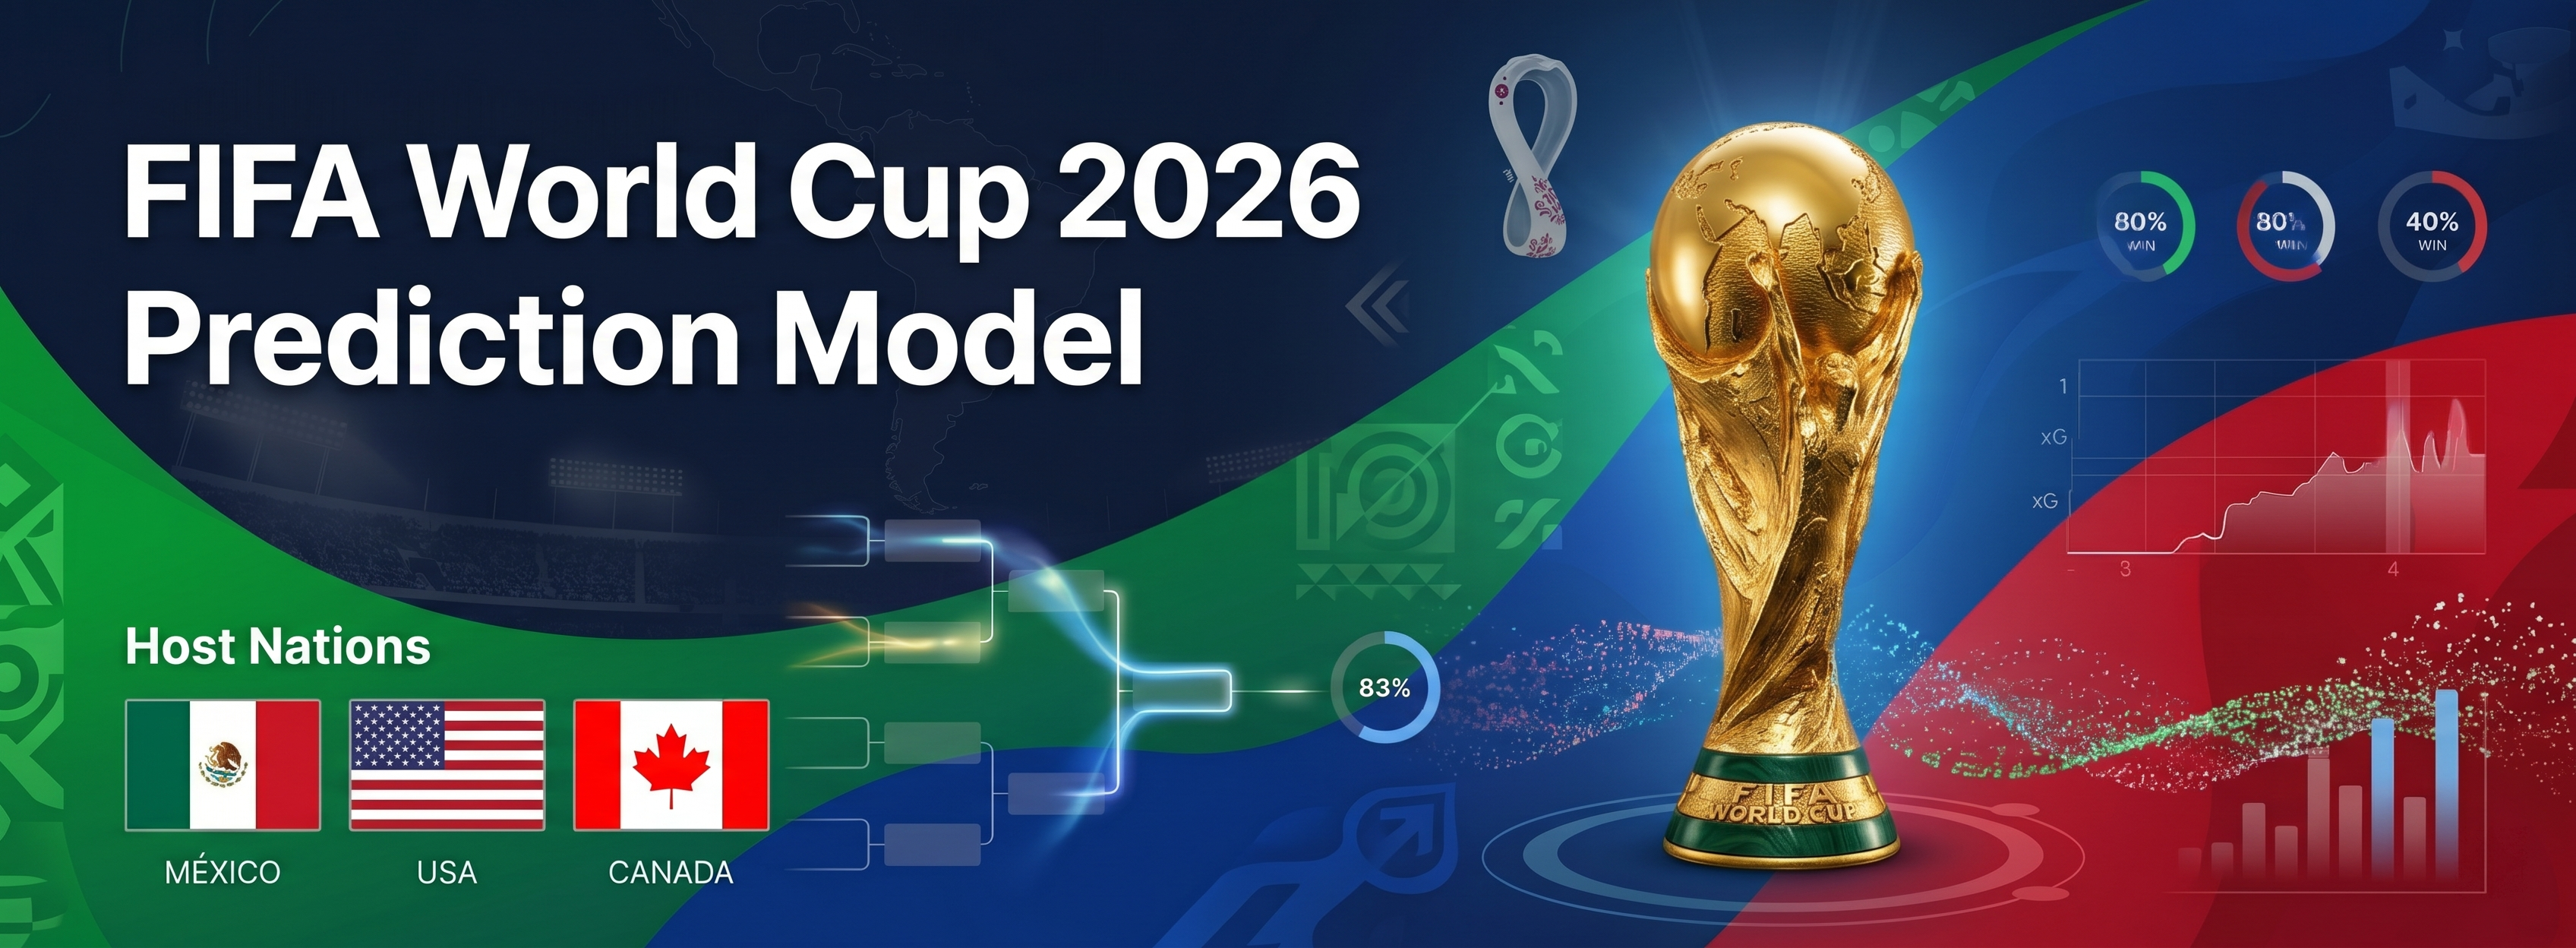
FIFA World Cup 2026 Prediction Model
A statistical model that forecast the 2026 World Cup one stage at a time — a Poisson + Elo ensemble trained on 48,000+ international matches and re-simulated after every stage, published as eight snapshots with scoreline-level predictions and an honest audit of how it did.
Python · statsmodels · Poisson GLM · Elo · Monte Carlo · Next.js
View project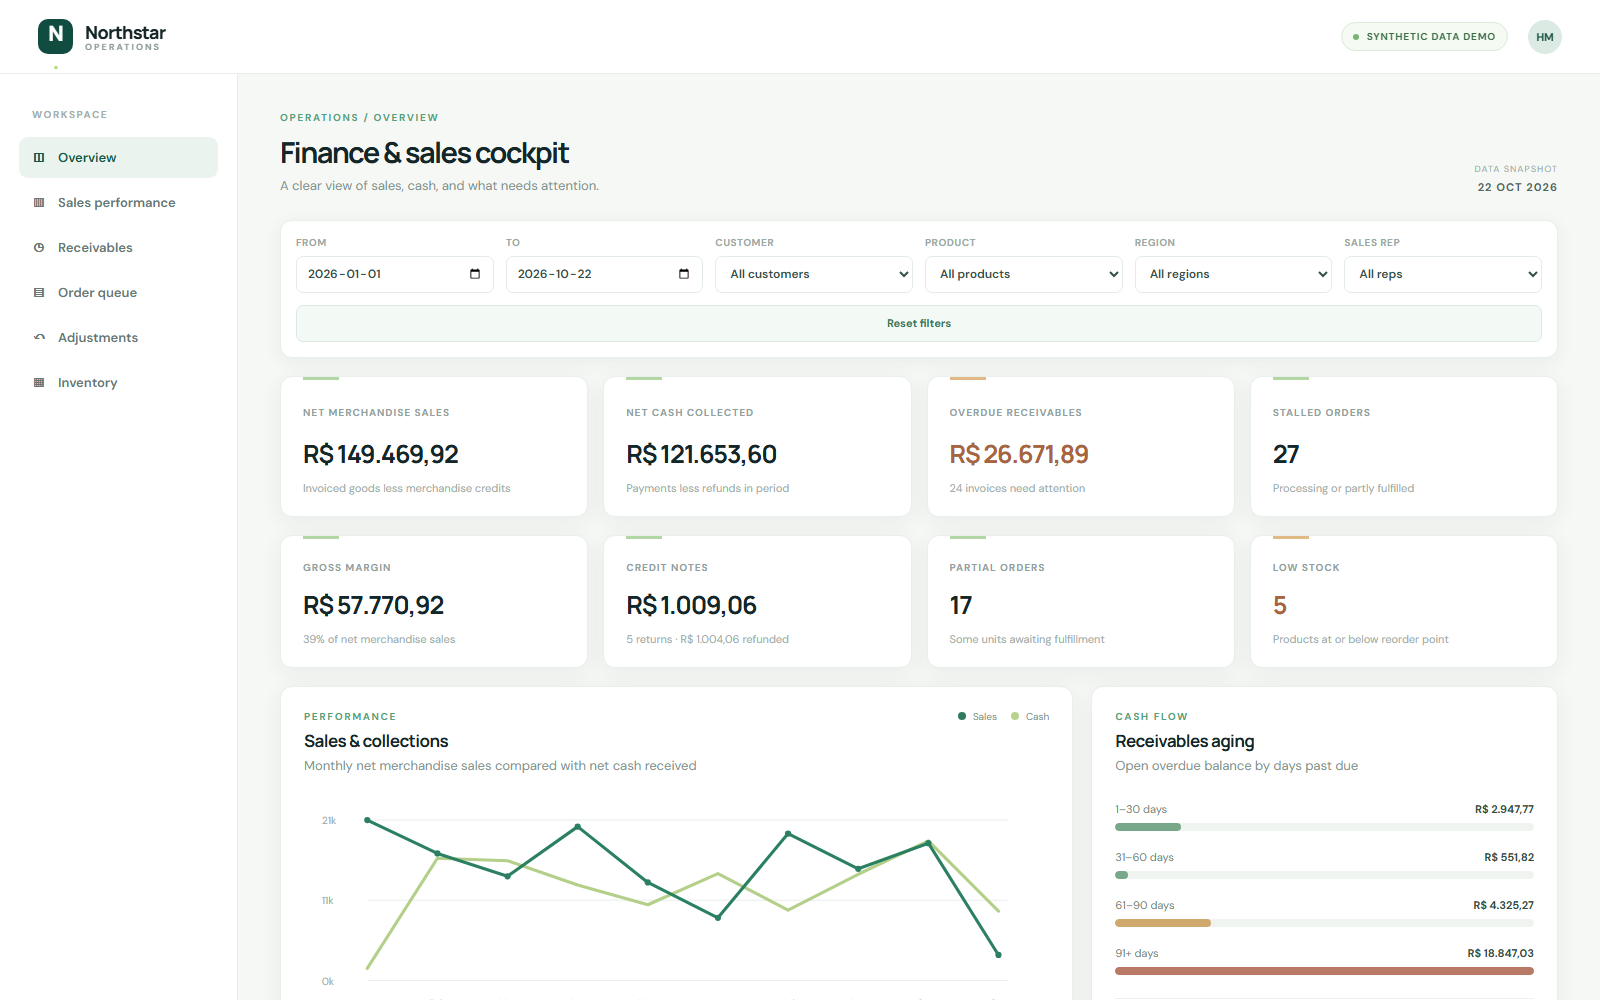
Analytics & BI
Live demo
Small-Business Finance & Sales Cockpit
An interactive operating dashboard for sales, collections, overdue installments, stalled orders, returns, and stock, using clearly labeled synthetic data.
Data Automation
Complete
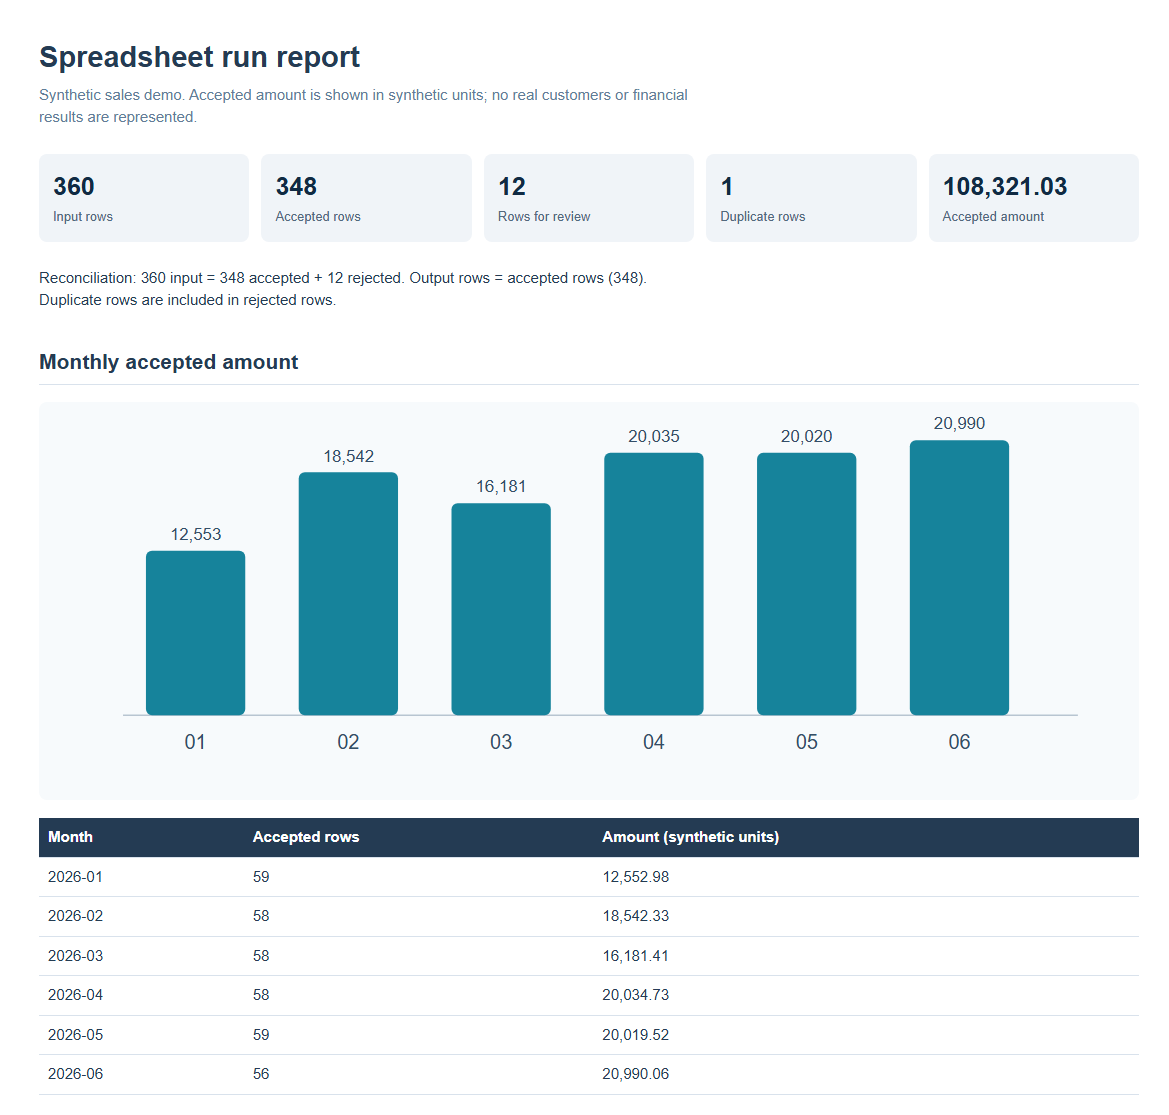
Spreadsheet Cleanup & Reporting Automation Kit
A working Python CLI that standardizes CSV and Excel exports, sends problematic rows to review, and produces reconciled data and a shareable report.
Data Engineering
Complete
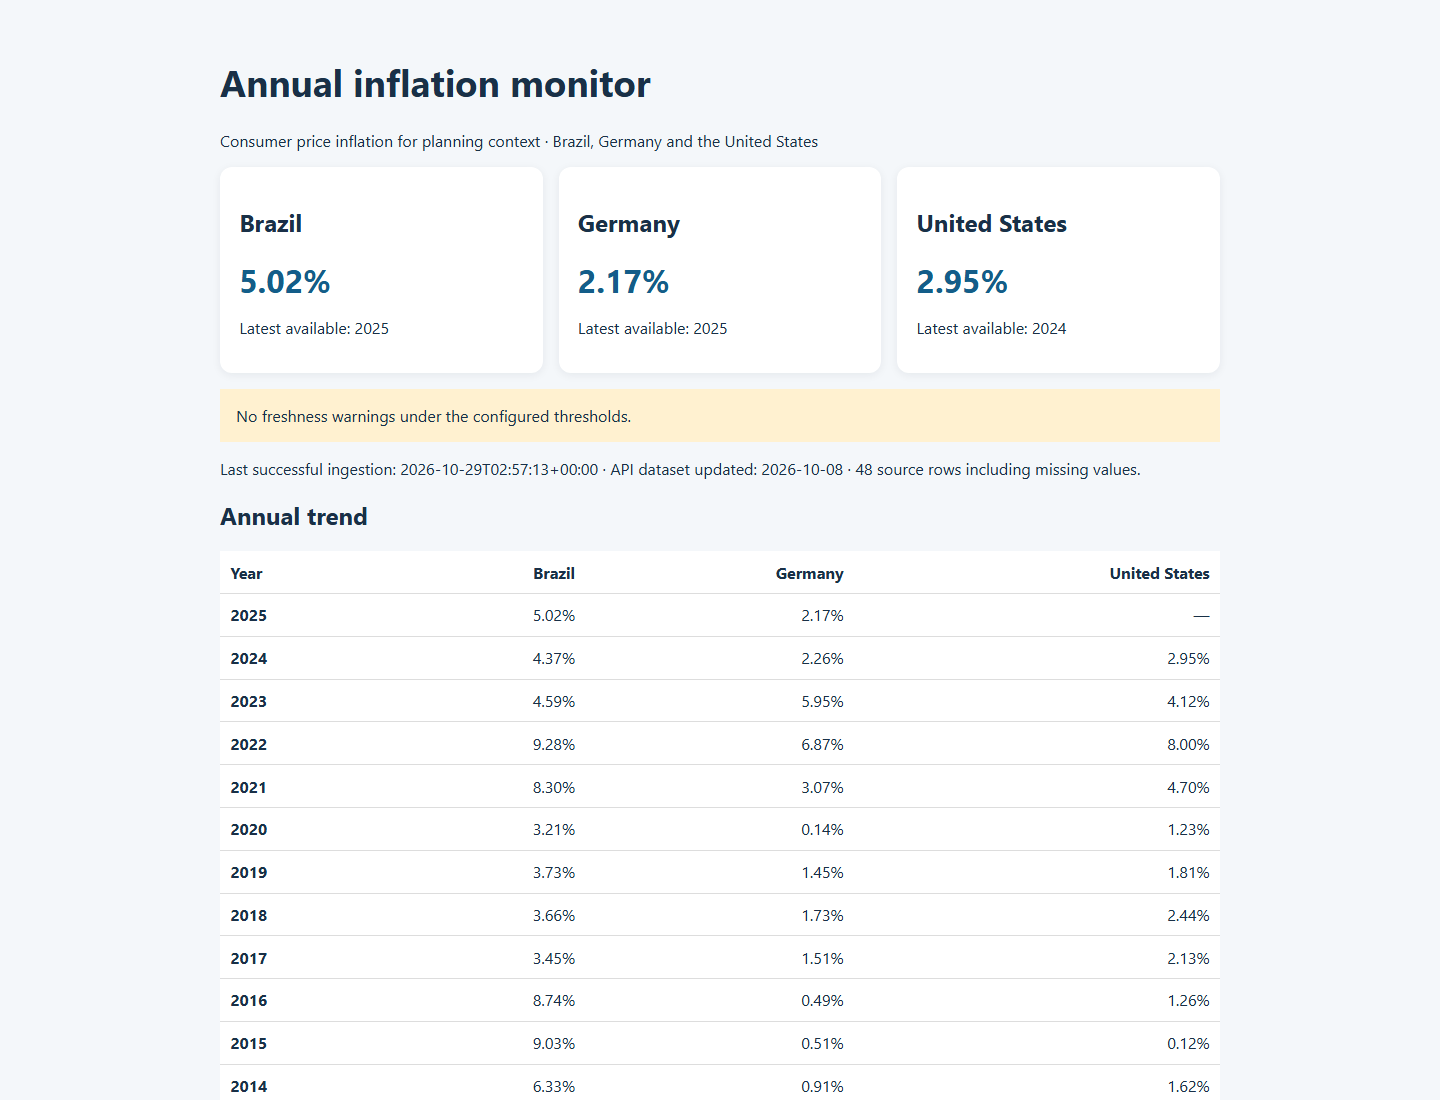
API-to-Reporting Data Pipeline
A reproducible World Bank API pipeline with validation, revision history and an annual inflation report.
Analytics & SQL
Live demo
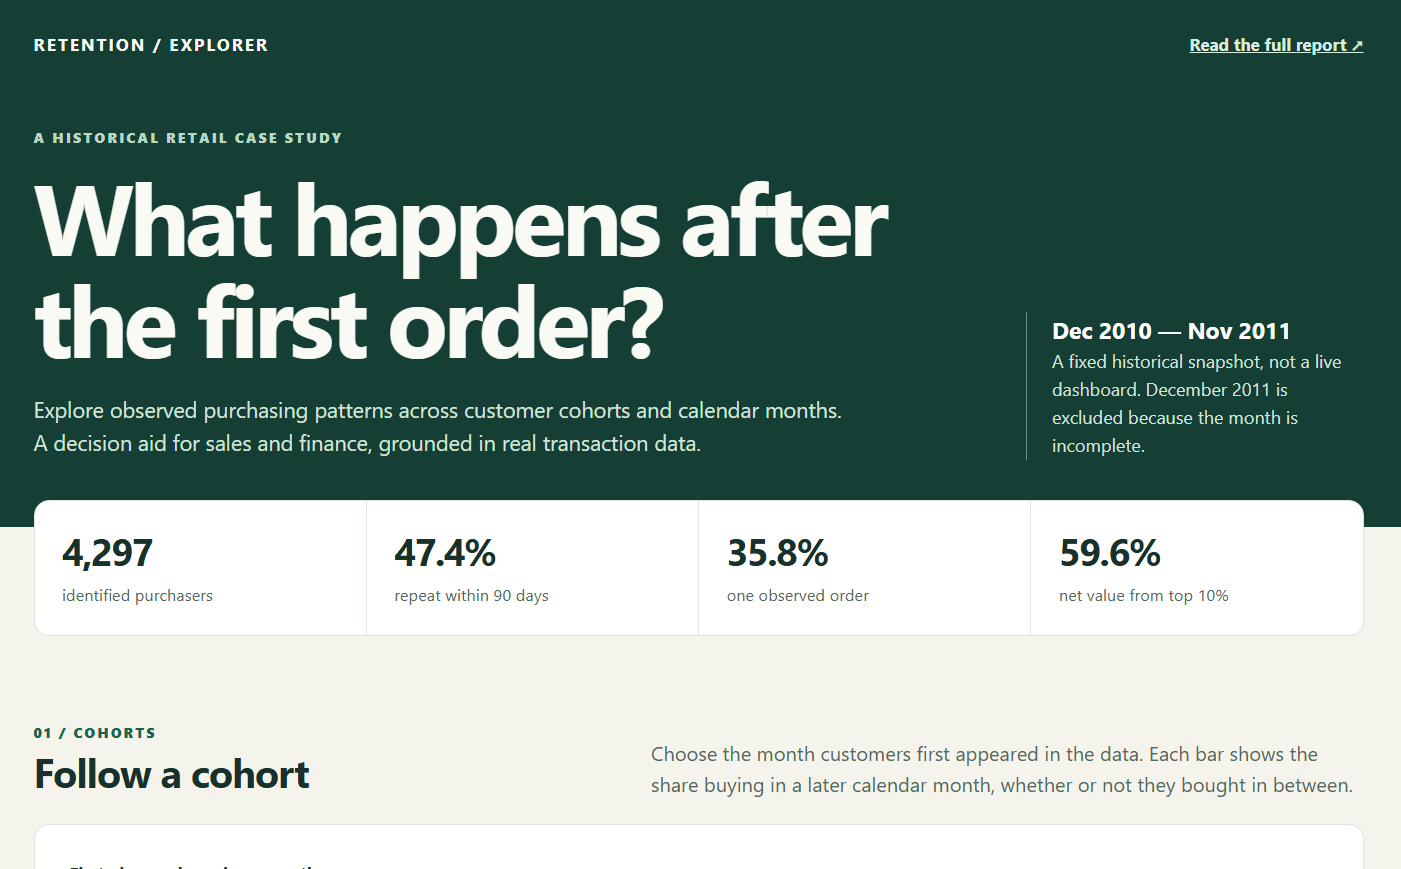
Customer Retention & Revenue Analysis
Explore customer cohorts, repeat purchases and revenue concentration in a historical retail dataset.
Services
Less manual work. Numbers you can trace.
- 01
Automate recurring work
Replace repetitive exports, spreadsheet updates and manual checks with scheduled, monitored workflows.
- 02
Connect systems and data
Bring ERP, APIs and files into one consistent data layer, with history, that your team can reuse.
- 03
Make reporting useful
Turn scattered numbers into dashboards and analyses tied to the decisions people actually make.
Background
An engineer’s habits, a data scientist’s tools
Production engineering taught me to look for the bottleneck before the technology. Data science gave me the methods to measure it. I work mostly in Python (pandas, scikit-learn, Streamlit) with SQL, Parquet, Power BI and Excel, plus SAP and API integrations when the data lives there.
Experience
- 2025 —
Data Specialist — Current role
Leads data work at a consumer-goods company: analysis, reporting and a Python extraction library on the ERP API.
- 2023 – 2025
Market Data Analyst II — Keyence Brazil
Python for SAP ETL into Power BI, a data warehouse behind the reports, and Python training for the department.
- 2022
Data Analyst, Early Associate — IBM
Intensive programme in EDA, APIs, NLP and image recognition, then document control on a client project.
- 2020 – 2022
Vertical Markets Intern — Thermo Fisher Scientific
Key-account dashboards and marketing initiatives, gathering data across departments.
Education
- 2023 – 2025
Postgraduate, Data Science and Artificial Intelligence — PUC-RS
- 2018 – 2022
Bachelor’s, Production Engineering — PUC-SP
Contact
Have a process that should run itself?
Write to me about the report, pipeline or model you have in mind. I’m open to full-time roles, freelance projects and remote work.
Elsewhere