Data Engineering · Complete
API-to-Reporting Data Pipeline
From a public API to a report you can trace and rerun.
- countries compared
- 3
- countries compared
- source rows in the snapshot, including missing values
- 48
- source rows in the snapshot, including missing values
- duplicate revisions on a repeated run
- 0
- duplicate revisions on a repeated run
The report is a fixed World Bank World Development Indicators snapshot, not a live dashboard. Inflation values may be revised and release dates vary by country. No scheduler or external monitoring service is installed.
Overview
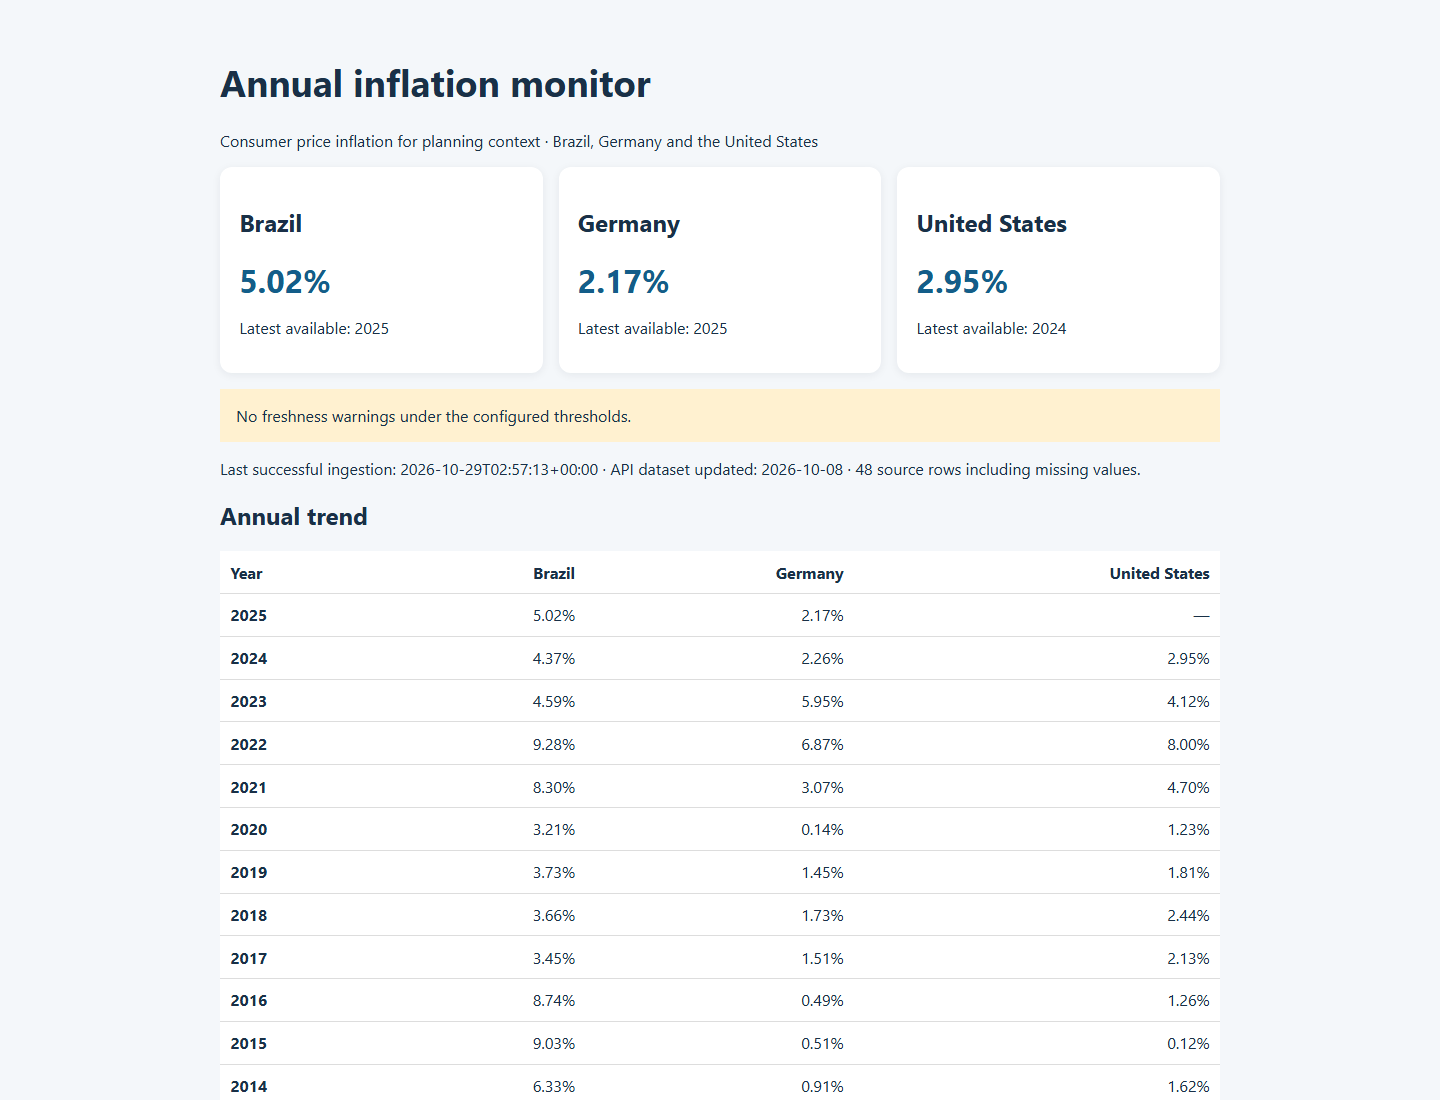
A small end-to-end pipeline retrieves annual consumer-price inflation for Brazil, Germany and the United States from the World Bank, stores observations and revisions in SQLite, and generates a static report for planning context.
Sample report
The Challenge
Public API data can be paginated, revised, delayed or incomplete. A useful report needs checks for missing records, safe repeat runs and clear information about freshness.
The Solution
Python fetches paginated data with retry and backoff, validates the complete response, and commits observations and revisions atomically. A run ledger and a static HTML report expose the latest successful ingestion and source update.
From source to report
- 01
Fetch the source
Retrieve paginated annual CPI observations from the World Bank API, with conservative pacing and retry/backoff for transient errors.
- 02
Validate before writing
Check schema, countries, years, pagination, counts and duplicate keys. A failed fetch preserves the last successful observations.
- 03
Keep history
Atomically update the SQLite snapshot and record changes to values, including transitions to or from missing values.
- 04
Generate the report
Display the annual series, last successful ingestion and source update date. Refresh requires running the pipeline again.
Results & Impact
The included snapshot contains 48 source rows across three countries; repeated runs do not duplicate observations. Annual CPI is not a forecast or company cost index. Scheduling and external monitoring must be configured separately.
What the pipeline demonstrates
Repeatable
Running the same snapshot again does not duplicate observations or revisions.
Observable
Run history and freshness warnings make the state of the data visible.
Honest about limits
Missing values stay missing; annual CPI is neither a forecast nor a company cost index.