Analytics & SQL · Live demo
Customer Retention & Revenue Analysis
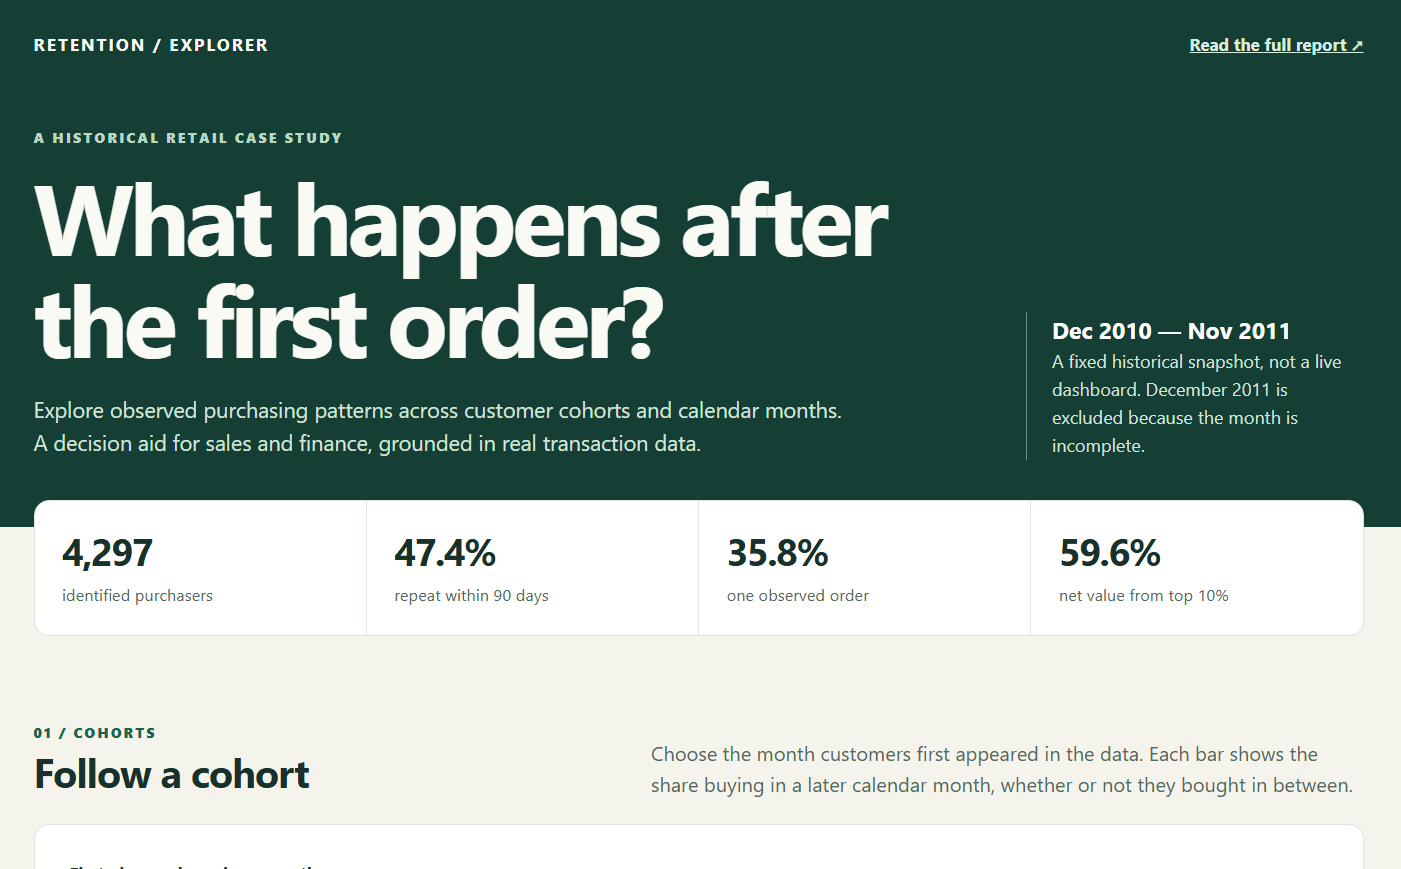
Explore what happened after customers placed their first observed order.
- identified purchasers
- 4,297
- identified purchasers
- repeat within 90 days among eligible customers
- 47.4%
- repeat within 90 days among eligible customers
- net transaction value from the top 10%
- 59.6%
- net transaction value from the top 10%
Real historical transactions from Chen (2015), UCI Online Retail, CC BY 4.0. The fixed 2010–2011 snapshot is not automatically updated. First observed purchase is not necessarily acquisition; anonymous transactions are excluded and refunds have limitations. Findings are descriptive, not causal.
Overview
A reproducible analysis and interactive explorer turn historical UCI Online Retail transactions into cohort activity, repeat-purchase and monthly views for sales and finance.
Inside the interactive explorer
The Challenge
Incomplete customer histories, unequal follow-up periods, anonymous transactions and refunds can make retention and revenue measures misleading.
The Solution
Python builds customer and order metrics, SQL independently checks key aggregates, and a static interactive demo lets visitors explore cohorts, monthly activity and order frequency with definitions and caveats.
Explore the analysis
- 01
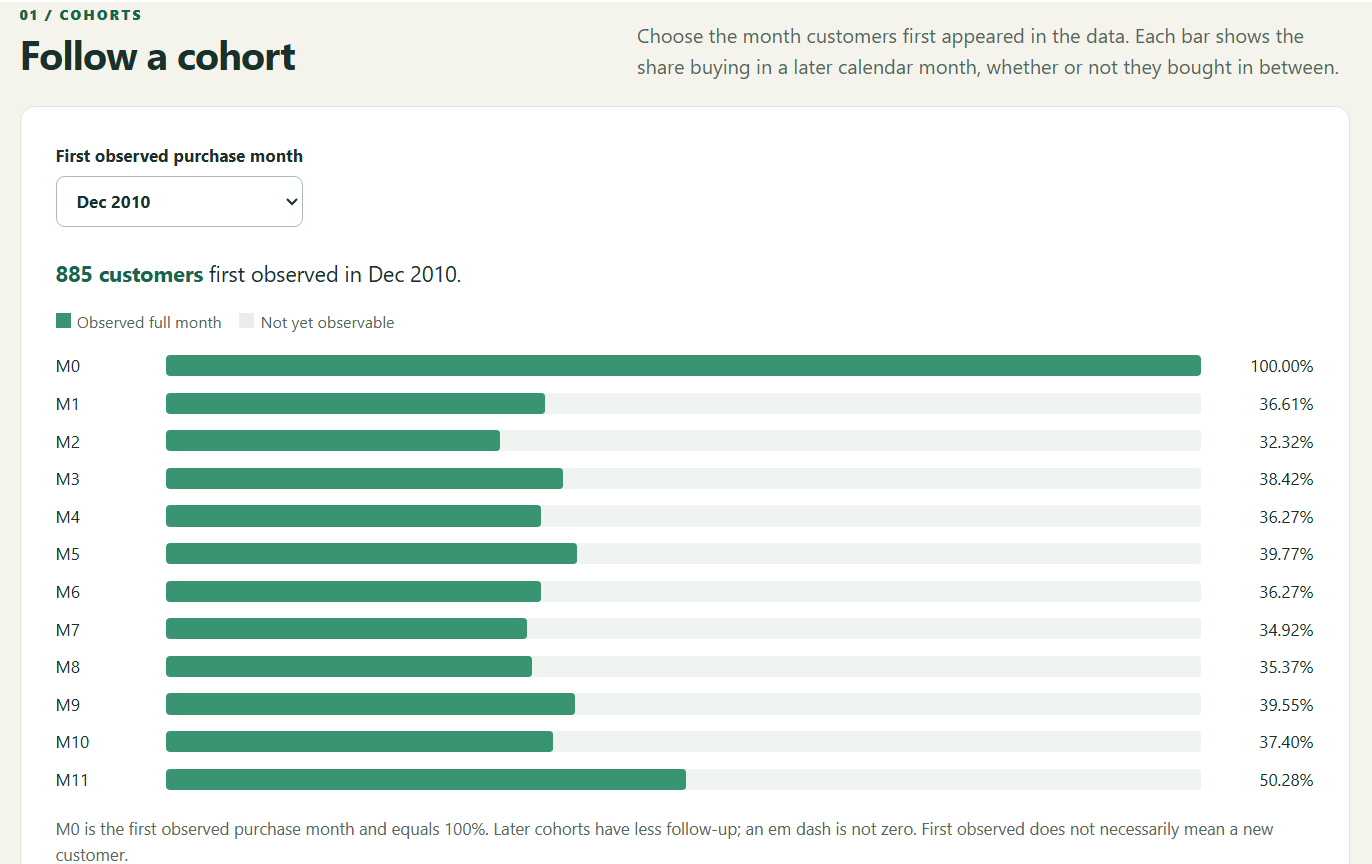
Choose a cohort
Select the month of first observed purchase and follow purchasing activity in subsequent complete months. Unavailable months are not zero.
- 02
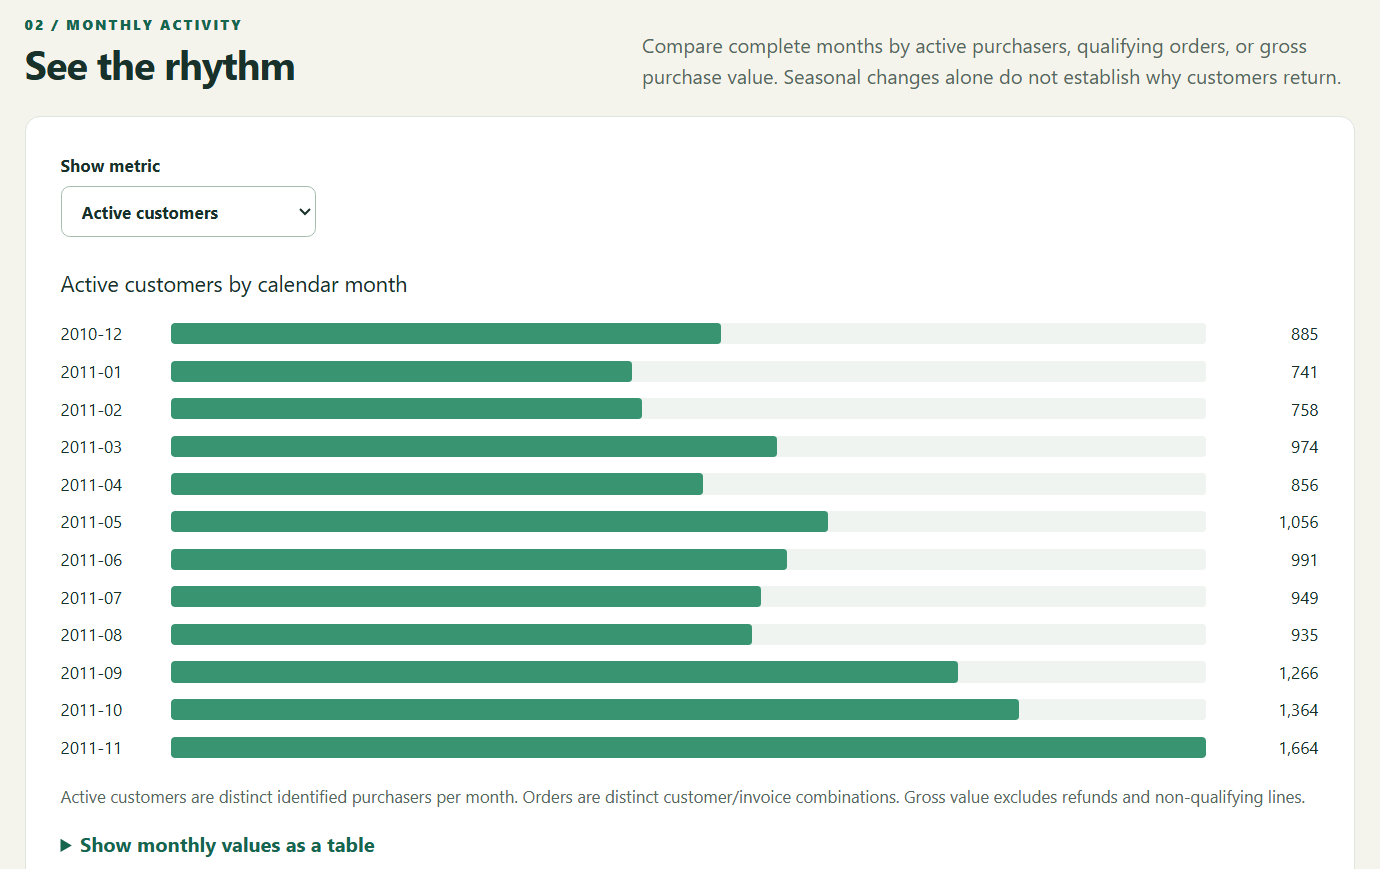
Compare monthly activity
Switch between active purchasers, qualifying orders and gross purchase value for complete calendar months.
- 03
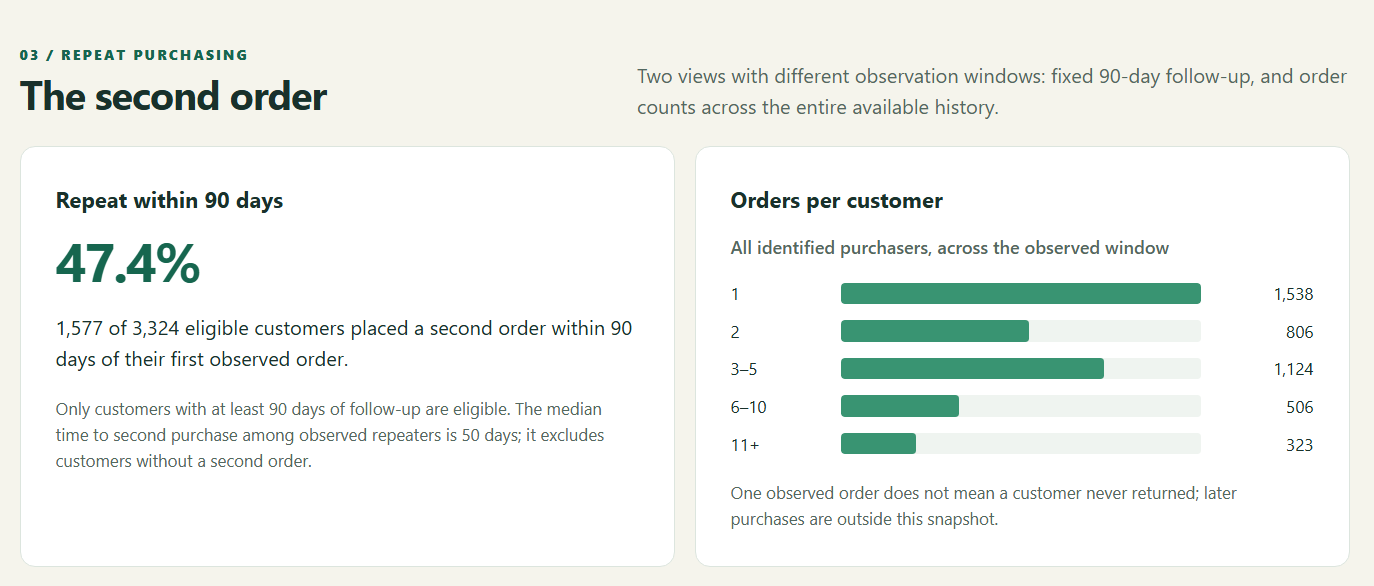
Understand repeat purchasing
Review 90-day repeat among customers with enough follow-up and the distribution of observed order counts.
- 04
Read the business brief
Inspect revenue concentration, definitions, refund treatment and questions for further investigation in the linked report.
Results & Impact
Of 3,324 eligible customers, 1,577 (47.4%) placed a second order within 90 days. The analysis covers a UK retailer from December 2010 through November 2011; observed patterns do not establish causes of churn.
What the analysis offers
Comparable follow-up
The 90-day measure excludes customers without a full 90 days of observation.
Reproducible
Python produces aggregates and a report; SQL checks key metrics independently.
Careful interpretation
Censoring, anonymous transactions and refunds are disclosed; patterns alone do not explain churn.